The Family of Galaxies
348-352
There is a great diversity of galaxy types. Figure 13.1 shows a Hubble image revealing a myriad of galaxy shapes and sizes. As in all sciences, classification plays an essential role. How are the different shapes of galaxies "related", does the morphology of galaxies fit a pattern, does our own Milky Way galaxy fit this pattern, can a galaxy "change its shape"? These questions will occupy us here.
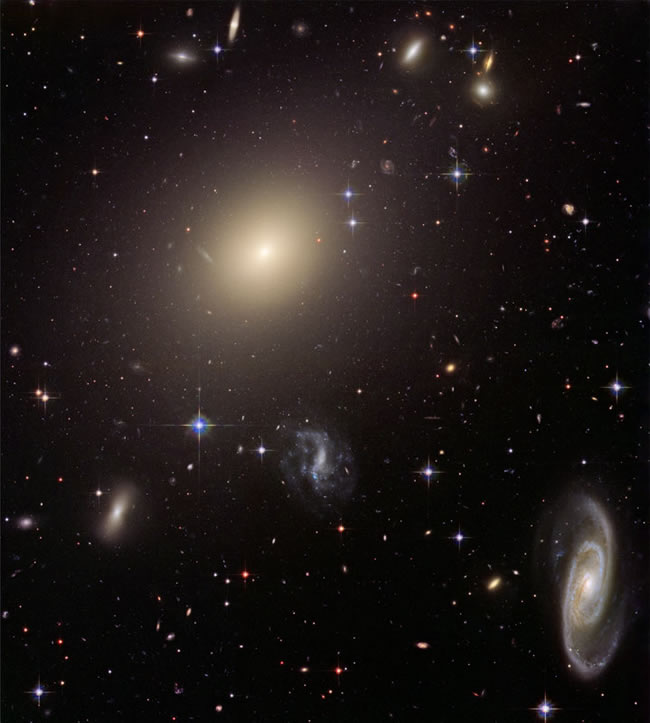 |
| Figure 13.1 HST image of the cluster of Abell S0740 - a cluster of galaxies more then 450 million light-years away in the direction of the constellation Centaurus. (credit: NASA, STScI) |
Finding Patterns
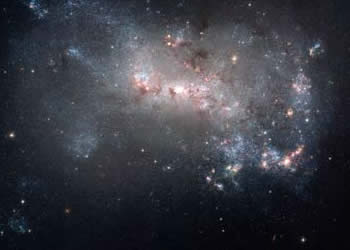
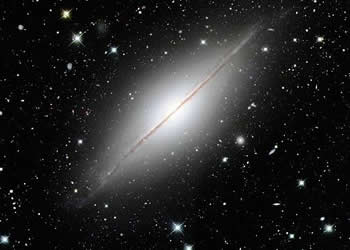
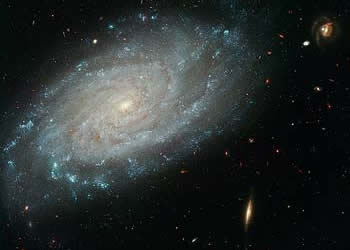
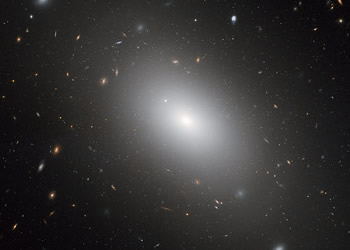
Figures 13.2a,b show two very different galaxies - a classic spiral and an elliptical galaxy.
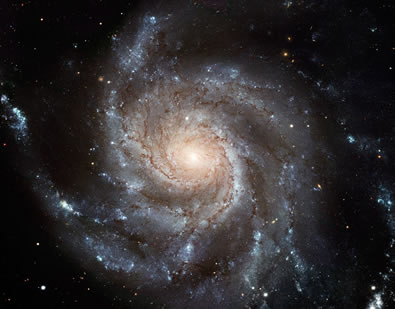
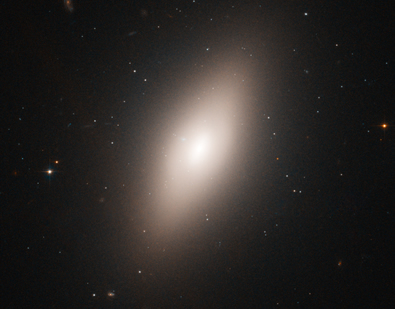
A quick inspection of Figures 13.1 and 13.2 will reveal three broad galaxy types (which we will refine further in a moment). Table 13.1 summarizes these three broad classifications:
| Three Main Galaxy Types... | Designation |
|
| Elliptical | The galaxies range from small mass (few hundred million stars) to enormous "titans" with trillions of stars. They have no disk or arms and little or no gas and dust and consist of older pop II stars. Current estimates are that approximately 60% of all galaxies are elliptical. | E0 - E9 |
| Spiral | These galaxies are of a more uniform size and mass with distinct spiral arms and disk. They contain a mixture of pop I and pop II stars as well as gas and dust. A small subset contain little gas and dust. | S0, Sa,SBa,Sb,SBb,Sc,SBc |
| Irregular | These galaxies tend to be smaller and highly irregular in shape. They are rich in gas and dust | Irr. |
| Table 13.1 Summary of 3 main galaxy types | ||
The Hubble Tuning Fork Diagram
A more refined morphology and one commonly used today was developed by Edwin Hubble. Figure 13.3 shows the Hubble Tuning Fork Diagram in which ellipticals and spirals are classified according to either their elongation or concentration of nuclear region. The spirals branch into two arms - one with a symmetric nucleus and one with galaxies having barred nuclei.
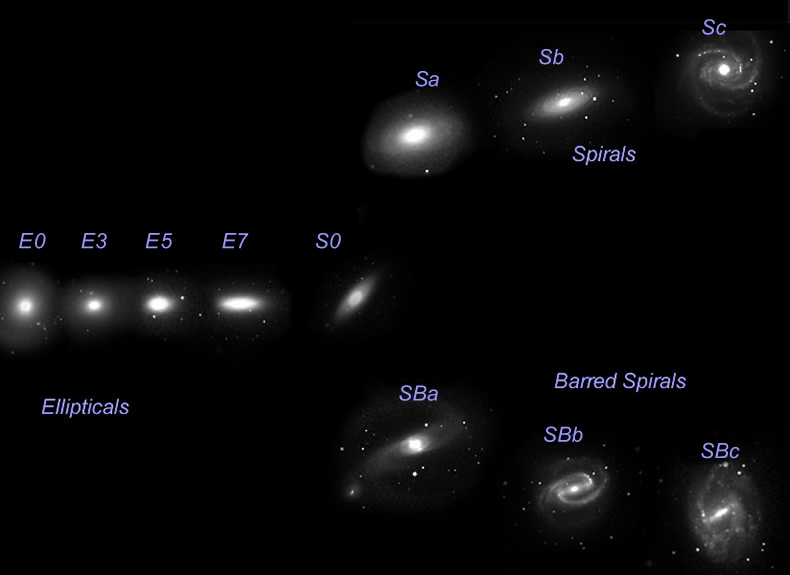 |
| Figure 13.3 The Hubble Tuning Fork classification scheme |
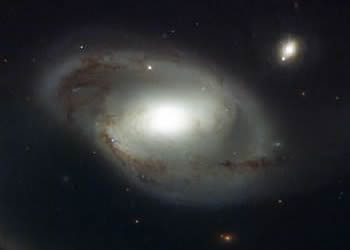
Example 13.1 Use the Hubble classification scheme to classify the Milky Way as shown on the left below.
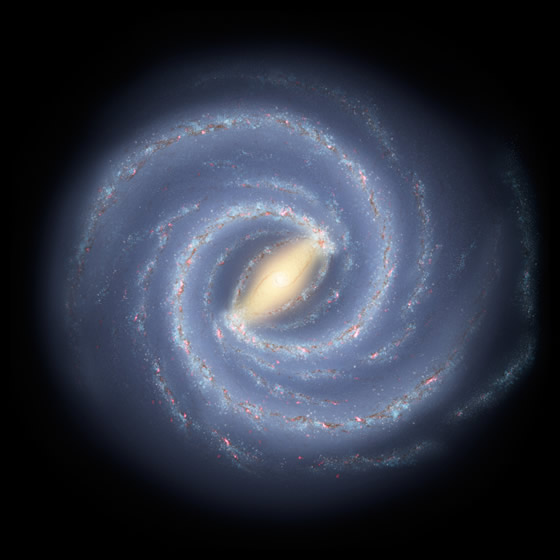 |
Solution: The first thing to note is the bar-structure in the nucleus. Next, look at the amount of concentration in the nucleus - it is closest to a "b-type". A good classification would be SBb. |
Colours of Galaxies and Selection Effects
Table 13.1 states that 60% or the majority of galaxies are elliptical. However, surveys in the visible part of the spectrum suggest that spiral galaxies are more common. How can these two contradictory claims be reconciled?
Consider another factor: elliptical galaxies have little or no gas and dust while spirals have large "reserves" of gas and dust. Finally, ellipticals consist of primarily population II stars while spirals also have young population I stars.
Example 13.2 How do the facts listed above help resolve the contradiction that while elliptical galaxies are more common we tend to "see" more spiral galaxies?
Solution: The solution comes when we consider the idea of colour of a galaxy. Population II stars are older and will consist primarily of red coloured stars. The blended light that we see will give the elliptical galaxies a more reddish colour. Spiral galaxies, on the other hand contain lots of bright, O and B stars which are both very luminous as well as much bluer. There are two contributing factors that will make it easier to see spirals than ellipticals: Spiral arms are very luminous due to the presence of OB associations and, blue light is scattered less than red light. Both of these factors contribute to making spiral galaxies seem to be more common than ellipticals.
We can easily conclude that spirals are more common than they are because of the reasons given above. This is called a selection effect. Selection effects result when a bias occurs in how data is collected or analyzed and understanding selection effects is a critical part of making sound, scientific inferences.
Just How Many Galaxies are There?
We can't really answer this question. A question we can answer, however, is how many galaxies can we see using present telescopes? Figure 13.4 is one of the deepest images ever made of the night sky. This is the Hubble Ultra Deep Field and was created from over 800 images taken in 11.3 days of observation! There are 8 foreground stars in this image. The rest of the objects are distant galaxies! There are over 10,000 galaxies in this image which covers only a tiny piece (about 1 ten-millionth) of the entire sky!
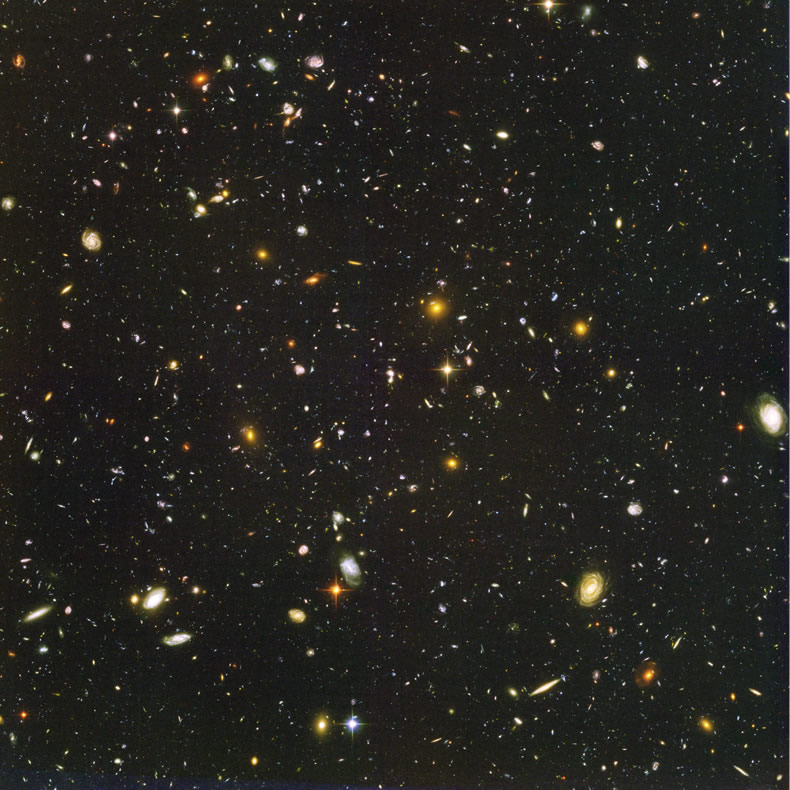 |
| Figure 13.4 The Hubble Ultra Deep Field image completed in 2004. (credit: NASA, ESA, S. Beckwith (STScI) and the HUDF Team) |
Example 13.3 Use the data provided by the Hubble Ultra Deep Field image to estimate a lower limit for the number of galaxies. Why is this an under estimate?
Solution: This is a scaling problem. If 1-ten millionth of the sky shows 10 000 galaxies then a simple estimate is that we would see (10 million) X (10 000) = (107) X (104) = 10 11 = 100 billion galaxies! The reason that this is an under estimate is that we are looking in only one wavelength region. It is reasonable to expect that we might see more galaxies if we looked with other wavelengths. In fact, in future chapters we will explore this possibility.
The most ambitious project to date to determine how many galaxies can be seen is the Great Observatories Origins Deep Survey or GOODS. It is a multi-wavelength survey using the great observatories (Spitzer, Hubble, Chandra and others). It confirms as reasonable the answer we got in Example 13.2.
Practice
|
||
a |
 |
(HST image) |
b |
 |
(CFHT image) |
c |
 |
(HST image) |
d |
 |
(HST image) |
e |
 |
(HST image) |
f |
 |
(CFHT image) |
|
||

To understand the diversity of galaxy types and how to classify them
Chp 16.1


Hubble's diagram is called the "tuning fork" diagram because of its similarity to a common lab tool - the tuning fork!
![]()