Measuring the Properties of Galaxies
353-361
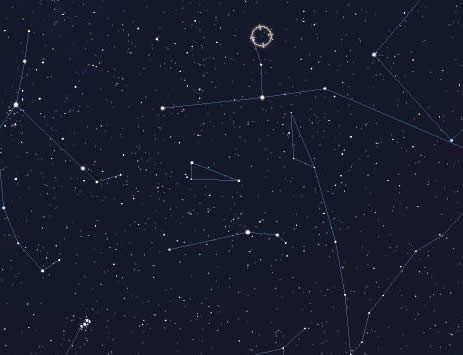
On a crisp fall evening, high in the eastern sky find the constellation Andromeda. Follow the middle star upward and, two faint stars up you will see a fuzzy "blob" a little smaller than the tip of your little finger extended at arm's length. You are looking at the "Great Nebula in Andromeda".
 |
Today we understand that the "Great Nebula" is actually our closest large-galaxy neighbour and is about 2.2 million light years away in the direction of the constellation Andromeda. How to determine the distances, masses, diameters and luminosities of galaxies will be the focus of this section. |
| Figure 13.5 Rollover image showing how to locate the Andromeda galaxy and an inset of what the galaxy looks like through a small "amateur-grade" telescope. |
Distance and Standard Candles
The universe is a BIG place! When dealing with distance on the galactic scale the appropriate unit to adopt is the megaparsec which is abbreviated Mpc. 1 Mpc = 3.26 million ly = 3.09 X 10²² m. Just as you did in previous chapters, you will again use the concept of distance modulus and the applet ![]() dMod to help aid you in any calculations that you make. Figure 13.6 provides you with this applet. We will also introduce the idea of
dMod to help aid you in any calculations that you make. Figure 13.6 provides you with this applet. We will also introduce the idea of
| Figure 13.6 |
the Standard Candle as a way to determine the distance to galaxies. As the name implies the Standard Candle is an object of known brightness that is used as a reference or standard from which you can determine distance. THere are a number of natural choices for standard candles:
Cepheid Variables
The Period-Luminosity relations (see Chapter 12.1) allow us to relate the period of a Cepheid variable star to its absolute magnitude. Cepheids make very good standard candles because they are very bright and can be seen at great distances.
Example 13.4 A classical Cepheid is discovered in a nearby galaxy. From the period luminosity relation you know that this star has an absolute magnitude of -6.5. Your measurement at the telescope yields an apparent magnitude of 18.5. What is the distance modulus for this star?
Solution: Remember that the distance modulus is a relatively simple idea - it is just the difference between apparent and absolute magnitudes. In the case the distance modulus is m - M = 18.5 - (-6.5) = 25
Once you know the distance modulus you essentially know the distance. In fact, because the distance modulus is so closely tied to the actual measurement made, astronomers often converse in terms of distance moduli rather than distances. After a little while you would gain an intuitive understanding that a distance modulus of 25 tells you that the object is well beyond our own galaxy but not that far away on a cosmic scale.
Example 13.5 How far away is the Cepheid in Example 13.4?
Solution: Use the applet dMod to verify that a distance modulus of 25 corresponds to a distance of 1 Mpc or 3.26 Mly
Bright supergiants (Ia)
Bright supergiant stars make useful standard candles because they are so luminous. This means that they can be seen farther away than Cepheids. A drawback, however, is that with out the benefit of a "period-luminosity" law there can be more uncertainty in the absolute magnitude. Despite this, supergiants do serve as useful standard candles.
Example 13.6 Suppose a bright supergiant (M = -9) is found in a CCD image of a nearby galaxy. Photometry reveals that the apparent magnitude is 22.2. How far away is the galaxy?
Solution: We know that m - M = 22.2 - (-9) = 31.2 . A quick look at the "rule of thumb" table on the right tells you this object is more than 10 Mpc away. The applet dMod confirms that it is 17.38 Mpc away.
Supernovae
Supernovae make very good standard candles because they are so luminous. Recall from Chapter 10.4 the absolute magnitude of supernovae range from -17 for Type II to -19 for Type I. This means that supernovae can be seen at very great distances. The most obvious draw back to using supernovae, however, is their inherent "unpredictability" - you can't always get a supernovae where and when you need it (a bit like a plumber!).
Example 13.7 In 2002 supernova SN2002ap occurred in the nearby galaxy M74 and is shown below (marked V). CCD photometry of the supernova reveals a magnitude of 12. The absolute magnitude of this supernova was -17.5. How far away is M74?
| Solution: Find the distance modulus: m-M = 12 - (-17.5) = 29.5. Using dMod you can conclude that M74 is about 8 Mpc or 26 million light years away. | 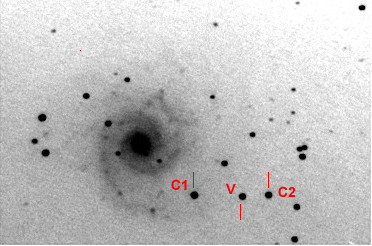 |
| Image courtesy The King's University College Observatory. |

The Tully-Fischer Relation
In the early 1970's the astronomers Brent Tully and Richard Fischer discovered a significant correlation between the width of the 21 cm emission line of a spiral galaxy and the absolute magnitude of the galaxy. The brighter the galaxy the more the 21 cm line is broadened. This gives a very good method to determine galactic distances since the 21 cm line width is "relatively" easy to measure.
Example 13.8: A series of 21 cm line measurements indicate (after applying the Fisher-Tuller relation) that a galaxy has an absolute magnitude of -18. A CCD image shows that the galaxy has an apparent magnitude of 16. How far away is the galaxy?
Solution: first calculate the distance modulus: m-M = 16 - (-18) = 34 then use dMod to conclude that the galaxy is 60 Mpc away.
"Standard Galaxies"
The last standard candle that we will investigate makes the assumption that in clusters of galaxies the brightest members will have similar absolute magnitudes.
Example 13.9: A cluster of galaxies 100 Mpc away has a brightest member with an apparent magnitude of 13. If this "brightest galaxy" and cluster is representative of all clusters then what is the absolute magnitude of the "brightest galaxy"?
Solution: First, let's figure out the absolute magnitude of the brightest galaxy in the 100 Mpc cluster. At 100 Mpc the distance modulus is 35, so m - M = 35 and 13 - M = 35 so M = - 22
Example 13.9 provides us with an estimate for the absolute magnitude of a "standard galaxy" as -22.
Time Machines
Even a small telescope is a "time machine". Nestled in the heart of the Virgo cluster of galaxies is a faint smudge M87. This is an enigmatic object to which we will return our attention later. For the time being, however, consider that when you see M87 you are looking at an object that is about 13 Mpc (megaparsecs) or 50 million light years away! You are looking back 50 million years into the past - not how M87 is but how it was. This is called the look-back phenomenon . As we peer into the depths of space we are also looking into the depths of time. The deeper we look into space the closer - perhaps - we come to the moment of creation itself.
Figure 13.7 is a Canada-France-Hawaii image of the heart of the Virgo cluster of galaxies. |
 |
| Figure 13.7 The centre of the Virgo cluster (credit CFHT) |
The Hubble Expansion Law
In 1929 Edwin Hubble published a law which now bears his name. Hubble showed that the farther a galaxy is away from us the more red shifted is its spectrum. The simplest interpretation is that the farther way the galaxy the faster it is receding from us. This is a profound discovery and we will return to it in Unit 6, Chapter 15. For the time being, however, we will use the Hubble Expansion Law as a tool to measure galactic distances.
Figure 13.8 provides you with an applet that illustrates the Hubble Expansion Law. Hubble discovered that galaxies appear to be receding from us in a linear way. This means that their speed of recession is proportional to how far away they are. In modern units, the constant of proportionality - called the Hubble Constant - is written H = 71 (km/s)/Mpc. This means that for every 1 Mpc of distance a galaxy has a recessional speed of 71 km/s. This can expressed in a very simple formula:
|
|
| Figure 13.8 |
where vr is the recessional velocity, H is the Hubble Constant and d is the distance measured in units of Mpc.
Example 13.10 An astronomer is analyzing the spectrum from a faint and very distant galaxy. She measures the position of the Hydrogen gamma line as 522 nm. Normally this line is located at 434 nm. How big is the red shift and how fast is the galaxy receding?
Solution: The redshift is just ![]() Now, use the Doppler formula
Now, use the Doppler formula ![]() to get the recessional velocity =
to get the recessional velocity = 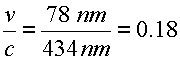 .
.
Finally, convert this to km/s by multiplying by the speed of light to get v = 54 000 km/s.
Once you have measured the redshift of a galaxy it is very easy to apply the Hubble Expansion Law to get the distance.
Example 13.11 How far away is the galaxy in example 13.10?
Solution: You can either use the applet or just apply the formula ![]() . From this you can conclude that the galaxy is approximately 761 Mpc or about 2.5 billion light years!
. From this you can conclude that the galaxy is approximately 761 Mpc or about 2.5 billion light years!
Diameter and Luminosity of Galaxies
Galaxies are big. If you can measure the distance to the galaxy as well as measure its angular size then it is an easy matter to determine the size of a galaxy. Let's try this for the Andromeda galaxy, 2.2 million light years away. On a very dark night with clear skies and a good pair of binoculars you would be able to measure the size of the Andromeda galaxy and find that it stretches nearly 4 degrees (about 8 times the diameter of a full moon) across your line of sight. The data that you will need is summarized in Figure 13.9.
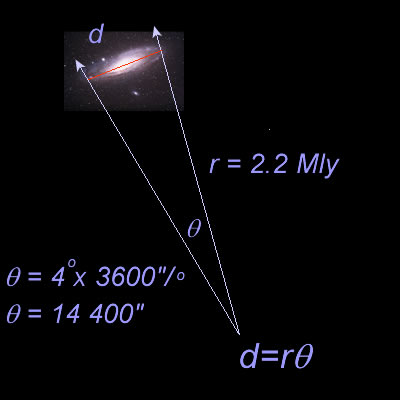 |
First, you will need to use the small angle formula (You may wish to review this in Chapter3.1 or 8.1. For more detail follow the "Take a Closer Look" below). Convert the angular size into seconds of arc and then use This gives:
This tells us that M31 is slightly larger than our own Milky Way galaxy.
|
| Figure 13.9 The Small Angle Formula applied to M31 |
 .
.
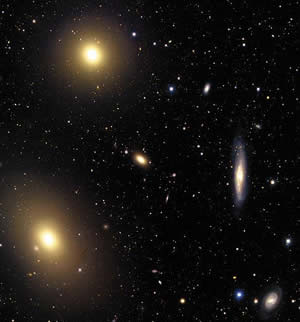
When the sizes of galaxies are determined and then compared it is readily apparent that there are tremendous ranges in galaxy sizes. You can already get a sense of this just by inspecting Figure 13.10 which shows part of the Virgo cluster of galaxies. Although there are numerous foreground stars there are several dozen cluster galaxies in this image. Since these galaxies are all at essentially the same distance from us it is clear that there is a wide range of galaxy sizes.
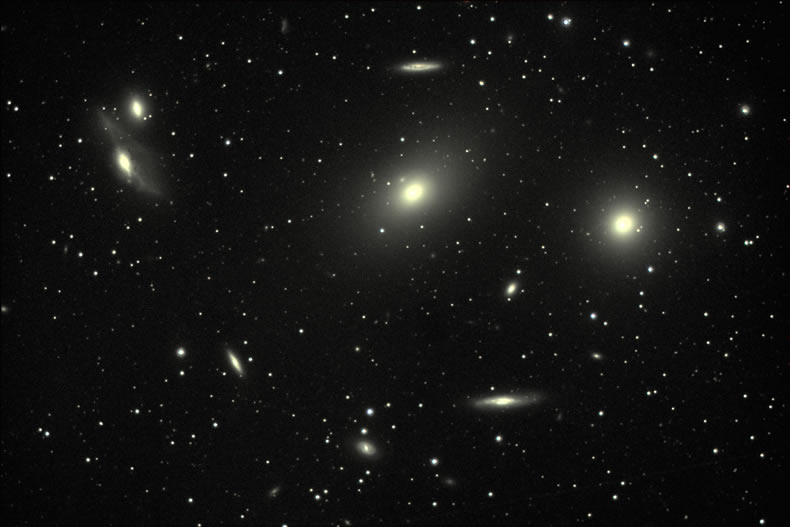 |
| Figure 13.10 Central part of the Virgo cluster of galaxies (Image courtesy NOAO) |
Table 13.2 summarizes variations in size, mass and luminosity of galaxies according to type.
| Type | Summary | |
| Irregular | These are small galaxies with typically 1% to 25% the mass of our galaxy. They also tend to be low luminosity and can be hard to detect. | |
| Spiral | Most spirals are smaller than the Milky Way but a few are known with diameters 4 to 5 times greater than the Milky Way and luminosities more than 10 times that of the Milky Way. | |
| Elliptical | Elliptical galaxies show the greatest variation in mass from 0.01 times the mass of the Milky Way to more than 10 times the mass. | |
| Table 13.2 Summary of galaxy size and luminosity | ||
Masses of Galaxies and the Case for Dark Matter
In Unit 4 you saw how Kepler's Laws of Planetary motion could be applied to binary star systems in order to determine the mass of a star. In Chapter 12 you applied Kepler's Laws in a slightly different way to infer the mass of the Milky Way when you studied the orbital velocity of stars around the galaxy. We now consider the difficult problem of determining the mass of other galaxies. What we find is confirmation of a problem first identified in Chapter 12.1 - up to 90% of the mass of galaxies is in a form we don't see!
Rotational Velocity and Mass
Figure 13.11 illustrates how the orbital velocity of stars in the galaxy can be measured by taking the spectrum of a thin slice of galaxy. Parts of the galaxy rotating toward an observer will be blue shifted while the parts receding will be red shifted. When plotted a curve of velocity versus position can be constructed. Just as you did in Chapter 12.1, you can then infer the mass of the galaxy by using the rotational curve method.
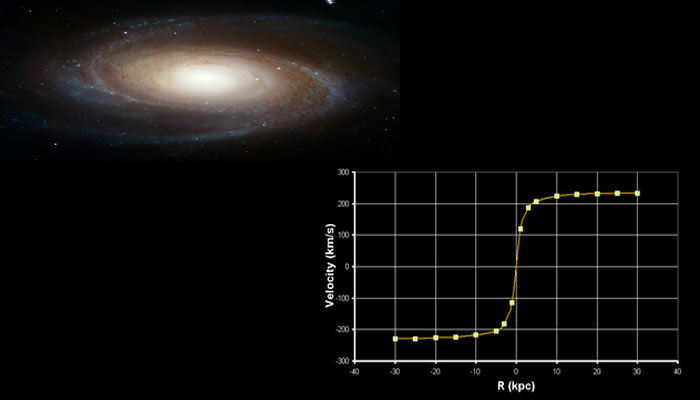 |
| Figure 13.11 Rotational velocity curve as a function of position |
As we discussed earlier, the flattening of the rotational velocity in outer parts of galaxies suggests that there is a very massive halo around most galaxies. This is one piece of evidence for the existence of Dark Matter.
The Cluster Method
Galaxies tend to live is clusters or small groups. Figure 13.10 shows the Virgo cluster. For a cluster to hold itself together there must be a balance between the motion of the galaxies which would try to disperse the cluster and the gravitational force that keeps the cluster together. By measuring how fast galaxies move in a cluster and by making the assumption that the cluster really is gravitationally bound together, the mass of the galaxies can be inferred. This is called the cluster method.
As early as 1930's, however, astronomers began to notice that galaxies in clusters were moving much too fast! More specifically they had too much kinetic energy to be gravitationally bound to the cluster. This is yet another indication for the presence of dark matter. You can use the applet galaxyCluster shown below in Figure 13.12 to experiment with how much dark matter is needed to hold a simulated cluster of galaxies of 20 galaxies together. In this applet galaxies are represented by small disks that interact with each other as well as dark matter within the cluster. You can adjust the fraction of dark matter in the cluster by using the slide control. For example, a fraction of 0.8 would mean that 80% of the cluster's mass was in the form of dark matter.
| Figure 13.12 |
Gravitational Lensing and Dark Matter
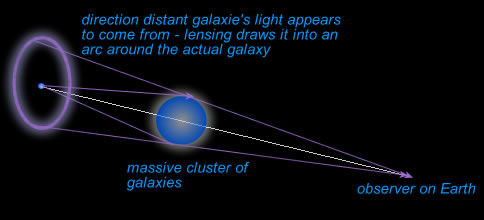 |
Einstein's theory of General Relativity predicts that matter will "bend" or warp space. One consequence of this is the deflection of light rays by gravitational fields. This creates a "lensing effect". Figure 13.13 illustrates this as. A distant galaxy, behind a massive cluster of galaxies will appear to be stretched out into an arc by the effect of gravitational lensing. Figure 13.14 shows exactly this in the case of the cluster Abell2218 which is bending the light from a much more distant cluster. |
| Figure 13.13 Gravitational lensing of a distant galaxy by a nearby cluster. |
In Figure 13.15 an apple (gravLens) is provided to let you experiment with gravitational lensing. By clicking and dragging the mouse across the image of Virgo cluster of galaxies you are simulating the effect that a very massive object would have on how we would see the cluster.
| Gravitational lensing provides another method to measure the mass of a cluster of galaxies. As in the other methods, masses inferred from gravitational lensing indicate that there is a great deal of mass in clusters that is not visible to us. Gravitational lensing provides a tools to "map" dark matter. We will return to a discussion of dark matter in Unit 6 when we consider its role in the overall structure and fate of the universe. | 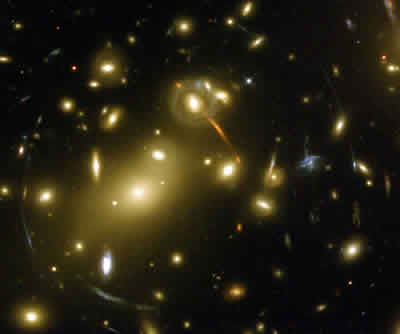 |
| Figure 13.14 Hubble image of the cluster Abell2218 (Image courtesy NASA, STScI) |
| Figure 13.15 |
Practice
- What is the distance modulus for a galaxy located 20 Mpc from Earth?
- A type I supernovae is observed in a distant galaxy. Photometry shows that at its brightest, the supernova had an apparent magnitude of 18. Estimate the distance modulus for this.
- Determine the distance to the parent galaxy in question 3.
- Experiment with Applet galaxyCluster and see if you can find the amount of dark matter needed to "build" a stable cluster of galaxies. What fraction of the mass is in the form of dark matter?
- Explain, in your own words, why astronomers think that dark matter exists.
- What is the Fisher-Tulley method?

To understand the key properties of most galaxies.
Chp 16.2

.

Distance moduli and distance follow a simple pattern based on powers of ten
Distance |
Mod |
|
| 102 | 100 pc | 5 |
| 103 | 1 Kpc | 10 |
| 104 | 10 Kpc | 15 |
| 105 | 100 Kpc | 20 |
| 106 | 1 Mpc | 25 |
| 107 | 10 Mpc | 30 |
| 108 | 100 Mpc | 35 |
![]()