Earth - The Active Planet
452 - 465
Does the Solar Nebula Theory which describes the formation of the solar system also agree with the detailed knowledge that we have about earth? You will start your study of comparative planetology with the Earth. It is important in this section to understand a number of major themes. These include evidence for different phases of planetary formation as well features that are unique to Earth. Try to keep the "Big Picture" in mind - how does the evidence provided by the Earth fit within the context of how we think planetary systems form?A number of the more salient features of earth are:
- composition
- atmosphere
- tectonic activity
- magnetic field
Evidence for 4 stages of Planetary Development
Stage 1: Differentiation and Composition
The earth has a typical density of 5.5 g/cm3 . As the young Earth cooled it formed a highly differentiated structure which today can be divided in 4 broad regions:
- a thin crust of the lightest materials which consists of silicates, traces of organic compounds.
- an inner mantle of rocky material (basalt etc)
- a hot, liquid core of iron and nickel
- an even hotter inner core of iron-nickel but the extreme pressure at the Earth's centre may make this more like a solid than a liquid
| The structure is from lightest to heaviest. This suggests that in the very early history of the planet elements migrated according to weight - provided that the earth was molten (liquid). This gives rise to differentiation of the planet's composition and also makes sense according to the SNT. As planetesimals collided and fused some of the kinetic energy of the planetesimals would be converted into heat. It would be quite easy to produce the temperatures needed to melt rock. As the era of planet formation ended the planet would begin to cool down - the silicate crust would harden around a hot and still molten interior. | 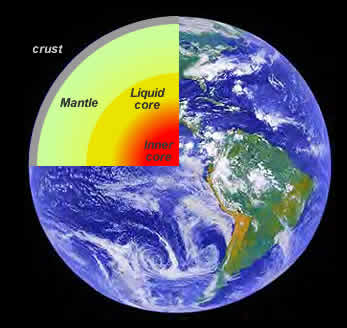 |
| Figure 17.1 Composition profile of the Earth |
Stage 2: Bombardment and Cratering
The early solar system was a busy place! Collisions between the newly formed planets and left over debris were frequent and violent. The scars of these events became visible once the earth had cooled enough to from a solid crust. Figure 17.2 shows a NASA-space shuttle view of the Manicouagan crater in northern Quebec.This crater is more than 70 km across and likely formed about 200 million years ago.
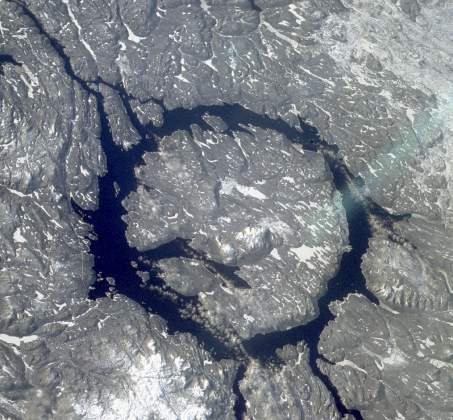 |
| Figure 17.2 The Manicouagan crater in northern Quebec. (Image courtesy NASA - STS9 crew) |
Stage 3: Flooding
Once the Earth had cooled enough to form a crust an new phenomenon began. Fissures in the crust would allow molten material from the mantle to flood large regions of the Earth's surface. Large lava flood planes are also observed on the lunar surface. Eventually, water vapour condensation lead to rain and flooding by water to form the first oceans.
Stage 4: Surface Evolution
This is the final stage and the one in which live. The surface of the Earth has been in constant, albeit slow, flux. Movement of the crust (plate tectonic activity) and weather erosion continually "re-make" the surface of the Earth. Over eons of time even large features such as the Manicouagan crater shown in figure 2 will disappear.
The Earth's Interior
How do we know the structure of the Earth more than 6000 km beneath us? One source of this knowledge is provided by earthquakes! The energy released by an earthquake radiates outwards as powerful waves capable of being felt literally around the world. Every time a major seismic event occurs, seismographs around the globe detect the event. By carefully studying the seismic waves that arrive at different detectors and at different times it is possible to piece together an accurate picture of the Earth beneath us.
One important property of seismic waves that physicists exploit is in the nature of the waves - how they are generated and how they travel. Seismic waves can come in two major types as illustrated in the video clips shown in Figure 17.3, and 17.4
| Figure 17.3 |
|
|
|
| Figure 17.4 |
|
|
S-waves travel slower than p-waves (by about 60%) and by carefully studying the arrival of s and p waves it is possible to get a very accurate picture of the density, temperature and composition of the Earth's interior. Figure 17.5 shows how S and P waves travel through the Earth after a major earthquake. The changing temperature and density of the Earth's interior causes the paths of the seismic waves to "bend" or refract and not travel in straight-line paths. Of particular importance is the shadow that the Earth's inner core casts on the earth opposite the seismic event. By carefully tracing which areas of the globe fall within the shadow a picture emerges of a very dense, more "solid-like" than liquid inner core.
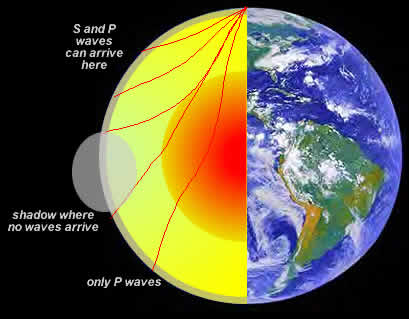 |
| Figure 17.5 The paths that S and P waves take during a seismic event. |
The Northern Lights also tell us about the Earth's Interior
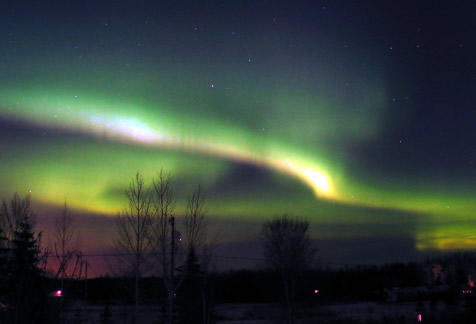 |
The northern lights like the ones shown in Figure 17.6 corroborate the story told by earthquakes and seismographs. In order to have northern lights the Earth must have a strong magnetic field and in order to have a magnetic field the interior of the earth must be an electrical conductor. This is consistent with our understanding that the core of the earth is composed of a rich iron-nickel mix. As well, in order to create a magnetic field the Earth must (as it does!) rotate. This will become a common motif in our study of the solar system - the presence of magnetic fields requires two essential things:
|
| Figure 17.6 Bright display of northern lights. (Image courtesy of The King's University College Observatory) |
The following animation illustrates the basic idea behind Earth's dynamo. Convecting iron-nickel in the interior creates a traveling current. When this combines with the rotation of the Earth a magnetic field is produced.
| Figure 17.7 |
Example 17.2 Look up the radius and mass of the Earth. From this determine the average density of the Earth and argue that this implies the interior of the Earth must be even denser.
Solution: The mass of the earth is 5.97 X 1024 kg and the radius is 6.38 X 10⁶ m. Since the volume of a sphere is ![]() it is easy to see that the average density is
it is easy to see that the average density is ![]() . This is considerably denser than most of the materials you would find at the Earth's surface (by about a factor of 2!) so it implies that the interior must be denser than this. This helps confirm our understanding that the interior of the Earth is composed of mostly iron and nickel.
. This is considerably denser than most of the materials you would find at the Earth's surface (by about a factor of 2!) so it implies that the interior must be denser than this. This helps confirm our understanding that the interior of the Earth is composed of mostly iron and nickel.
Earth's Active Crust - Plate Tectonics
 |
Geologists
discovered early in this century that the continents "ride along" on
large subsurface sheets or plates that move across the earth's mantle with dizzying speeds of a few cm per
year! The earth's crust looks like a child's attempt to glue together her
mother's favourite tea cup! Along the joins in the crust we see a great
deal of tectonic activity.
Earthquakes and volcanoes are prevalent along and indeed help trace out the location of plate boundaries where one plate collides with another. There are probably 11 main plates covering the earth's mantle. As plates meet mountains may be thrust upward or one plate may may be pushed under another which can lead to powerful subduction earthquakes. |
| Figure 17.8a Plate collision leads to formation of mountains as well as zones where earthquakes occur | |
 |
The 2005 earthquake and Tsunami were the result of this kind of seismic event. In other locations plates may slip along each other forming the kind of earthquake that devastated Haiti in 2010. The origin of plates makes sense in the SNT. As the molten earth cooled a skin formed. The surface tension in the skin and churning convective motion of the molten core helped prevent the skin from cooling into a uniform continuous covering. The motion of the plates is powered by the convection that is occurring in the deep interior and mantle of the earth. |
| Figure 17.8b Plate movement also creates sea-floor spreading and allows hot material from the mantle to rise into the crust. |
We see far from plate boundaries a different phenomenon - sea-floor spreading which allows mantle material to cycle upward to replace old crust lost through subduction. As it turns out, this is a vital process in maintaining earth's hospitable atmosphere.
| Plate movement continually renews crustal material as some material is subducted (returned into the Earth's mantle) while new material wells up from below through sea-floor spreading. This same process also removes carbon dioxide rich material from the ocean floor and eventually returns CO2 to the atmosphere through volcanic activity. | |
| Figure 17.9 |
The Atmosphere
The atmosphere, while vital to us, is but a mere vaporous skin to the planet. Early
differentiation in the formation of the solar system drove off most of the light
elements. However, traces of compounds such as carbon dioxide, nitrogen and water vapour would be released or outgassed from the cooling crust of the Earth. This led to the formation of the first or primary atmosphere on Earth. It is also possible that Earth may have accreted additional ice-like materials rich in CO2 and H2O
in the early solar system and added to its atmosphere.
One reason that we think that the original atmosphere on Earth must have been very different than today's atmosphere comes when we compare the composition of the atmosphere (Table 17.2) with the composition of the Sun. If both formed from the same solar nebula with no other additional processes involved then their compositions should be similar. If you look at the abundance of the element Neon-20 on the Earth and compare it to the abundance on the Sun a very different picture emerges. The Neon-20 present (in very trace amounts) today is the same Neon-20 that would have existed in the very early solar system. This element is non-reactive and too heavy to escape into space. However, if you compare the relative amounts of Nitrogen to Neon in our atmosphere with the same ratio of Nitrogen-Neon on the Sun you will find something interesting. For the Sun the N/Ne ratio is about 5 while for Earth the N/Ne ratio is about 10 000! This tells us that our atmosphere is much richer in Nitrogen than the solar nebula itself. Some other process (likely outgassing) must have helped to elevate the amount of Nitrogen in Earth's atmosphere.
| The atmosphere that now covers the Earth is the secondary atmosphere and is the one that has formed with the emergence of life on Earth. Most important and possibly a signature for life-sustaining atmospheres is the relatively high concentration of Oxygen in Earth's atmosphere. |
|
||||||||||||||||||||
| Table 17.2 The Secondary Atmosphere. Gases with asterisk are one's whose concentration can be variable. |
Structure of the Atmosphere
As complicated as it sounds - it is rather simple to estimate the mass of the Earth's present atmosphere. You really only need to know to things: 1) The radius of the Earth and 2) the average atmospheric pressure at sea level. In the following example we will use this to determine the mass of our atmosphere.
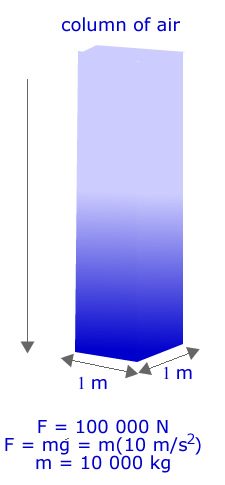
Example 17.3 Given that atmospheric pressure is approximately 100 KPa or Kilo Pascals and that the radius of the earth is 6.38 X 10⁶ m, estimate how much the atmosphere "weighs"?
Solution: First start with the basic idea of what air pressure is. One "Pascal" of pressure is 1 N of force per square meter of area. At sea level the air exerts a pressure of a bit more than 100 000 Pascals per square meter!
As the figure on the right shows, in order to have a pressure of 100 000 Pa at the surface of the Earth there must be a column of air of mass 10 000 kgs above that square meter. This is because the weight of a column is just equal to its mass times the acceleration of gravity. SInce every square meter on the surface of the earth supports 10 000 kg of air all we need to do is multiply the surface area of the earth by 10 000 kg / square meter to get the total mass. Recall that the surface area of a sphere is given by the formula
The Earth's atmosphere has a mass on the order of 5 X 10¹⁸ kg or 5000 trillion tonnes! |
 |
The atmosphere thins rapidly as you leave the surface of the Earth. By the time you reach an altitude of 15 km you have traveled through 85% of the mass of the Earth's atmosphere. Figure 17.10 shows the "structure" of the atmosphere and its division into four regions
The atmosphere is divided into four layers - each based on the temperature of the atmosphere.
|
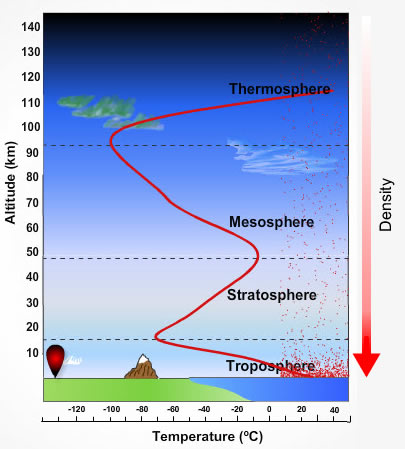 |
| Figure 17.10 Earth's atmosphere and its 4 major layers. |
Example 17.4 The thickness of Earth's atmosphere has been compared to the thickness of the layer of shellac on a school room globe. Is this a "good" comparison?
Solution: A layer of shellac is usually only about 10-4 m thick. If this is covering a globe that has a radius of 10 cm then the ratio of the thickness of shellac to the globe is 10-4 m/0.1 m = 10-3 or 1 part in a thousand. If you compare this to the thickness of the Troposphere and radius of the Earth you find the ratio is 15 km/6380 km = 2 X 10⁻³ or 2 parts in a thousand. So - yes this is a reasonable comparison!
As example 17.4 emphasizes - Earth's atmosphere is a tiny yet absolutely essential part of our world. Our recent understanding of how humans can influence climate helps underscore the fragility of our atmosphere.
Oceans, Carbon Dioxide and Other Greenhouse Gases
Although Oxygen is essential to our survival so to is the gas Carbon Dioxide or CO2. This may surprise you since you know that CO2 is a greenhouse gas and the increasing concentration of CO2 in Earth's atmosphere has been linked to dramatic climate change over the past century. To understand the role of CO2 look at the applet in Figure 17.11. The applet illustrates how CO2 molecules are able to trap infrared radiation from the Earth and to give this energy to either Nitrogen or Oxygen molecules through a process called collisional de-excitation.
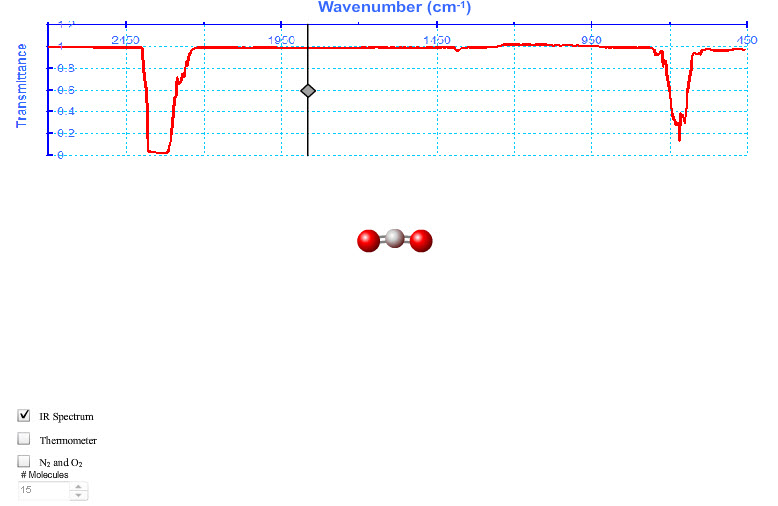 |
Figure 17.11
) |
Nitrogen and Oxygen molecules are unable to absorb the infrared radiation emitted by the Earth and without the trapping effect of CO2 this energy would be radiated back into space without heating the Earth's atmosphere. If that were the case then the average global temperature would be a very chilly -15 C! CO2 however acts like a warm blanket on a winter night and traps this energy and thus heats the atmosphere. This is called the greenhouse effect.
Greenhouse Gases are Essential!
Yes - we need greenhouse gases. The following applet illustrates what would happen if the GHG content of our atmosphere changed appreciaibly. Without enough GHGs we are too cold and with too high a GHG concentration we are too hot! Nature maintains a wonderful balance but we are dangerously "experimenting" with this balance!
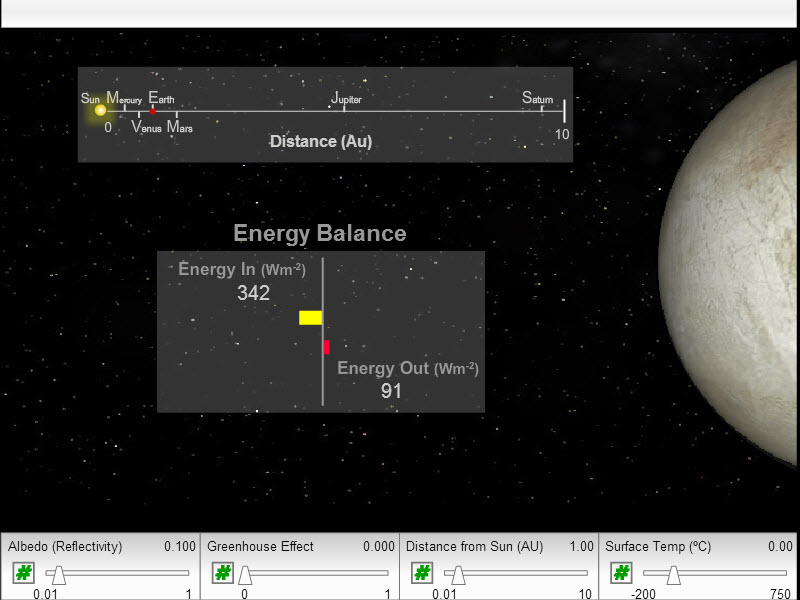 |
Figure 17.11a
) |
The net effect of the CO2and other greenhouse gases is to raise the atmospheric temperature by about 30 C to give us a very habitable mean global temperature of about +15 C. Clearly we need the greenhouse effect!
To learn more about other greenhouse gases explore this 
| Figure 17.12 |
Figure 17.12 shows how CO2 levels and temperature follow each other. The concentration of CO2 in this graph varies from below 200 parts per million (ppm) during major ice ages to as high as 300 parts per million. Just prior to the onset of the industrial revolution (circa 1750) the atmospheric concentration of CO2 was about 270 ppm.
However, as Figure 17.13 reveals today the rapid increase in CO2 levels which have resulted from human produced CO2 shows a striking relationship with increasing temperature. Currently CO2 levels are above 380 ppm which is higher than any value over the past half million years!
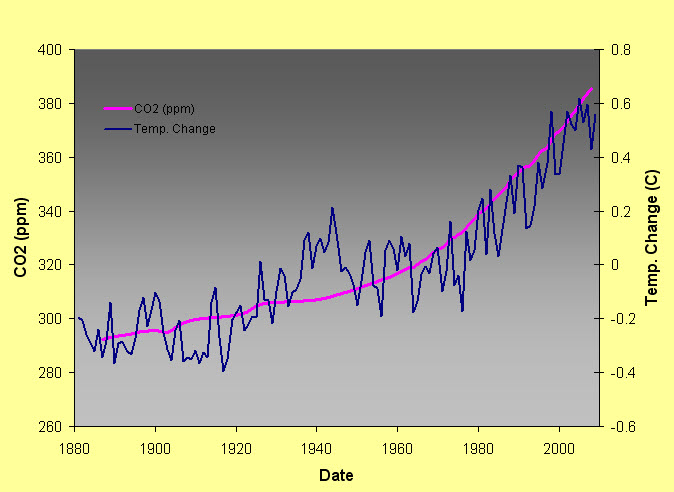 |
| Figure 17.13 CO2 and change in average mean global temperature 1880-2008 |
An important player in the way in which CO2 levels behave is the ocean. Carbon dioxide is absorbed into the ocean. Prior to the rapid increase in CO2 due to human industrial activity a relatively stable balance existing between naturally produced CO2 and the amount being removed ("scrubbed") by the oceans and plants. This balance is achieved through a remarkable set of factors:
Figure 17.14 shows this cycle. |
 |
| Figure 17.14 The "CO2 Cycle" |
Example 17.5 Why is it reasonable to expect that for the very early Earth CO2 levels in the atmosphere were much higher than they are today?
Solution: Once the Earth had cooled to the point that oceans of water could form, CO2 in the atmosphere would be quickly absorbed. This is because CO2 is highly soluble in water. The ocean would be able to absorb huge quantities of CO2 before an equilibrium with the atmosphere would be established.
Oxygen in the Earth's Atmosphere
The early atmosphere was likely rich in CO2 with very little Oxygen. Despite this many life forms could thrive (most even today do not consume oxygen). Oxygen is a highly reactive gas and would quickly combine with minerals in the soil. Rust is a common example of this reactive behaviour. Photosynthesis in plants, however, produces oxygen as a by-product as plants absorb CO2 and light energy from the Sun. Eventually (probably 2 billion years ago) the rate of oxygen production by plants (including simple algae and other aquatic life) exceeded the rate at which oxygen was re-absorbed. This lead to a steady increase in oxygen in Earth's atmosphere. At this stage a new process began. The build up of oxygen in the atmosphere was in the form of molecular oxygen or O2. However, some of the O2 was able to rise to the stratosphere where interaction with the intense UV radiation from the Sun produced a different kind of oxygen molecule O3 or ozone. Ozone at this level in the atmosphere is extremely important to life because it is a very effective absorber of UV radiation. THe development of more complex life forms (including you) depends critically on this fragile protective layer of Ozone high in the stratosphere.
While life does not require an O2 rich atmosphere the presence of O2 could signal the presence of life more similar to the kind of animal life that we find on Earth. One of the challenges for exo-planetary astronomy will be to detect Earth-like planets around distant stars. The Kepler mission should identify potential candidate planets. Should a future astronomer discover, by spectroscopic analysis, an O2rich atmosphere around such a planet it could prove very interesting!
Practice
- Look at map. South America and Africa look like they could fit together like pieces in a jig-saw puzzle. Is this merely a coincidence or does it suggest something else?
- How do northern lights tell us about the interior of the Earth?
- Explain why the very earliest atmosphere on Earth is almost certainly NOT the atmosphere that we currently have.
- True or false - the greenhouse effect is essential to the development of a habitable climate on Earth. Discuss your reasons.
- Why are O2 rich atmospheres "un-likely"? What property of oxygen makes production of an O2 atmosphere difficult?
- Every year, by burning fossil fuels, we inject roughly 10 billion tonnes of CO2 into the Earth's atmosphere. Explain why this is a potential problem for the planet.
- How big an increase in atmospheric CO2 concentration would 10 billion tonnes of CO2 represent? Is this consistent with the observed change in CO2 concentration over the past century?
- Explain how the CO2 cycle works and the role that the ocean plays in regulating the amount of CO2 in Earth's atmosphere

Chp 20-1,2,3,4
![]()

Energy is transported by waves. Most waves require a medium through which they pass. Air, for example, is the medium for sound waves.

The Earth's crustal plates move about as fast as your fingernails grow! A few cm per year.

A common misconception is that the greenhouse effect is all bad! In fact, we rely on the greenhouse effect to make our planet habitable. But you can have "too much of a good thing" - the problem is too large a greenhouse effect will have drastic and adverse affects on life.
![]()
link to applet showing hsitorical levels of ghgs and temperature
Two common misconceptions about ozone are:
- All ozone is bad! Not true. Tropospheric ozone is a harmful pollutant but we depend critically on the ozone layer in the Earth's stratosphere.
- Ozone depletion and global warming are NOT the same! The "ozone hole" and ozone depletion are the result of the introduction of compounds called chlorofluorocarbons or CFCs into the Stratosphere. This is quite different than the warming effect produced by increasing concentrations of GHGs in the Troposphere.